There are many new features in HTML5 to get excited about. The one which caught my curiosity was HTML5 Audio / Video API. I was overwhelmed with ideas for applications (like face detect login or inline dictation) but I chose to start with something small - a whistle detector. Try it! the accuracy is pretty good actually. I used M. Nilsson’s research paper, ”Human Whistle Detection and Frequency Estimation” to implement this. It took me a while to get understand the paper but luckily, after a lot of experimentation, I got the right idea.
For the first part, I would try to explain Successive Mean Quantization Transform (SMQT) which prepares the audio data for further processing.
Successive Mean Quantization Transform
Transformation in mathematics is an operation to map one set to another set. SMQT is a similar method that removes bias or gain resulting from disparity between various kinds of sensors (microphones). In SMQT, we recursively take mean of data set and split it into two halves and do the same on each half. Data values above the mean are assigned, “1” and below are assigned “0”. The recursion is carried out to a pre-defined depth, at the end of which we have a binary tree with 1s and 0s. Sounds confusing? Lets take and example of set:
X = [89, 78, 63, 202, 90, 45, 112, 79, 95, 87, 90, 78, 54, 34, 66, 32].
Mean(X) = 80.875
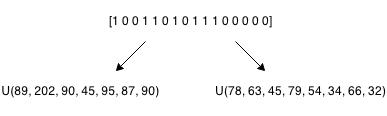
The values above mean are assigned “1” while below are assigned “0”. So it becomes - [1 0 0 1 1 0 1 0 1 1 1 0 0 0 0 0]. Let this procedure be called as U(X). Data values corresponding to “0” propagate left of the binary tree while “1” propagate right. So we have a tree which looks like,
Continue this process recursively till you reach a depth of L. ( Note: L = 8 in our application. )
After this, you weight each level by multiplying the bits by 2cur_level - 1 and add it up to the top of tree. So, if you have a tree which looks like,
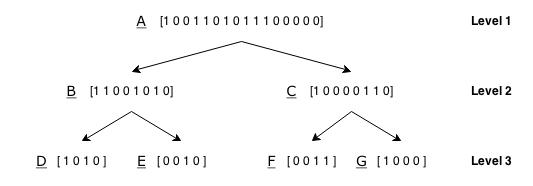
Multiply D, E, F, G by 22 which gives [4 0 4 0], [0 0 4 0], [0 0 4 4], [4 0 0 0] and so on. Lets call this procedure of weighing individual arrays as W(X). After we are done weighing, we add to the node its subtrees. For eg, B = W(B) + (W(D) . W(E)). So, we have now have audio data that is bias and gain free. (Gist).
Normalization and FFT
For the purpose of this detector we will use chunks of 512 elements for which we will calculate SMQT to a max depth of 8. After we have taken SMQT of audio data, we would normalize this result so that its values fall within range of [1, -1]. we will divide the values by 2L - 1 and subtract “1” from the result.
Taking the Fast Fourier Transform of the normalized data will give us an array of N = 256 elements. Let this FFT be denoted by F(T).of frequency. Point to be noted here is, because we are using 256 elements to represent a range 0 - 22Khz, each element will represent about ~43 Hz of frequency. To detect a whistle, we will need to extract two feature vectors.
Calculation of feature vectors
Human whistle generally falls in the range of 500 - 5000Hz. Want to try? Take a look at FFTExplorer. Our estimation of whistle will involve calculation of two feature vector (or, values in simple terms). In the first step, we will find result of band-pass and band-stop filter applied on F(T) in the frequency range (500 - 5000Hz), called pbp(t) and pbs(t). Although, the way I have implemented filters is pretty basic (and wrong). I have attenuated amplitudes to a fixed value but filters are generally much more complex than that.
The two feature vectors aim at finding out the spikes in our frequency range, strongly suggesting presence of a whistle. The two feature vectors result from following requirements:
-
The largest value in pbp(t) should typically be larger than the mean of pbs(t) in the presence of whistle
-
In presence of whistle pbp(t) has typically a few very dominant values.
First feature vector
For the first feature vector we will use the following equation,
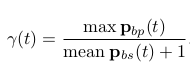
The value must be greater than 25.
Second feature vector
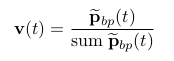
The second one is bit tricky. First we will take find a new array by.
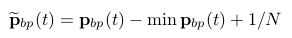
Next, we calculate two vectors, given by
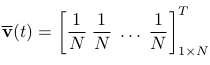
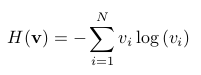
The theory behind this is to detect peaks by comparing both the vectors. For measuring the similarity, we will exploit Jensen Difference, given by,
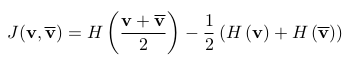
The value of J(v, v') must be around .44.
Note: The threshold values are only meant for general terms. If you find suitable you can use other values to suit your needs.
Threshold positives and accuracy
The problem of false positives will still persist for various kind of noises and sounds. To be more precise, we can can calculate no of positive samples within X no. of samples and compare it with our threshold. If it exceeds threshold positives, then it probably is a whistle. For our project, the chosen threshold is 5 which can be increased for further accuracy.
The whistle detector is quite accurate even under influence of acceptable noise but the accuracy will decrease with lowering of threshold. However, increasing to much higher value may fail to detect to even a long whistle. So it must be around to be accurate enough for a practical application.